


GHG Emissions
Understanding, measuring, and mitigating greenhouse gases for businesses

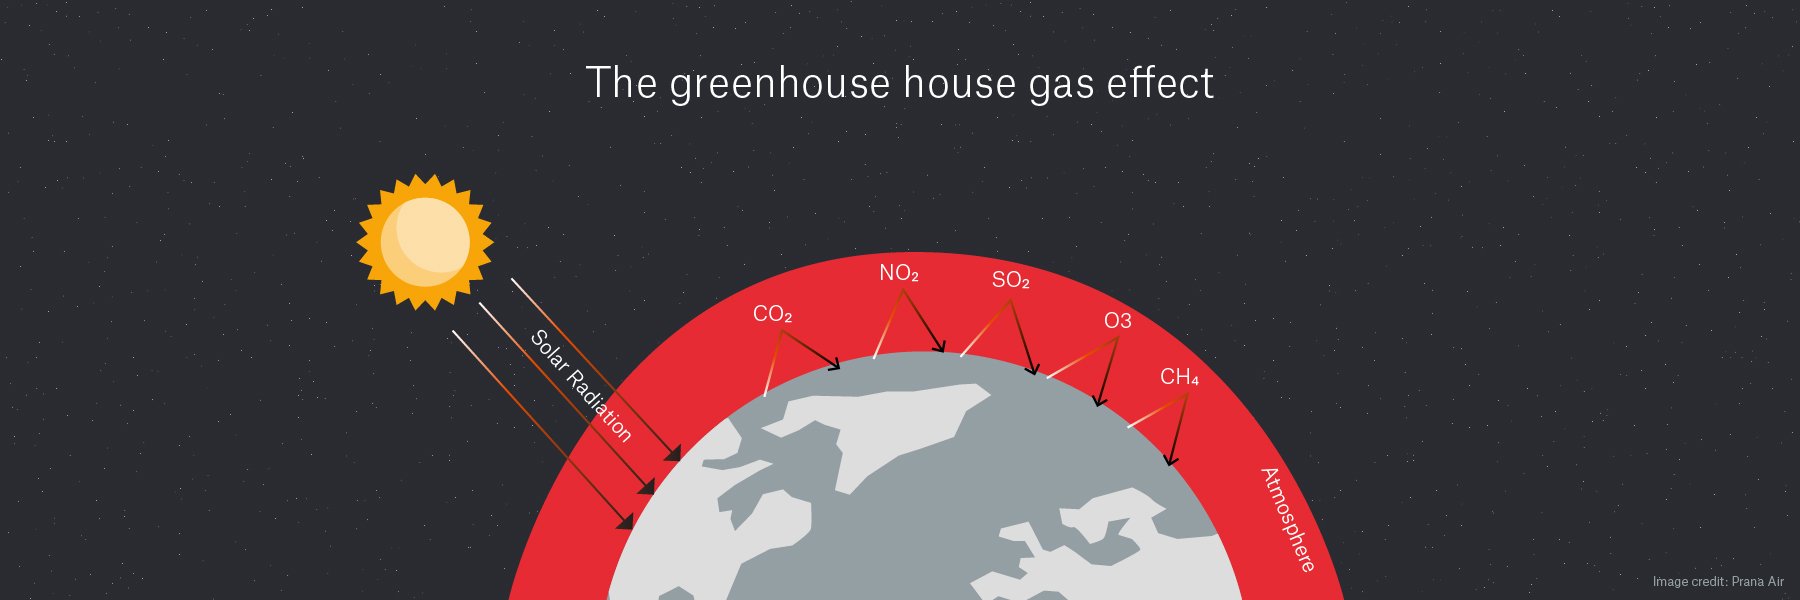
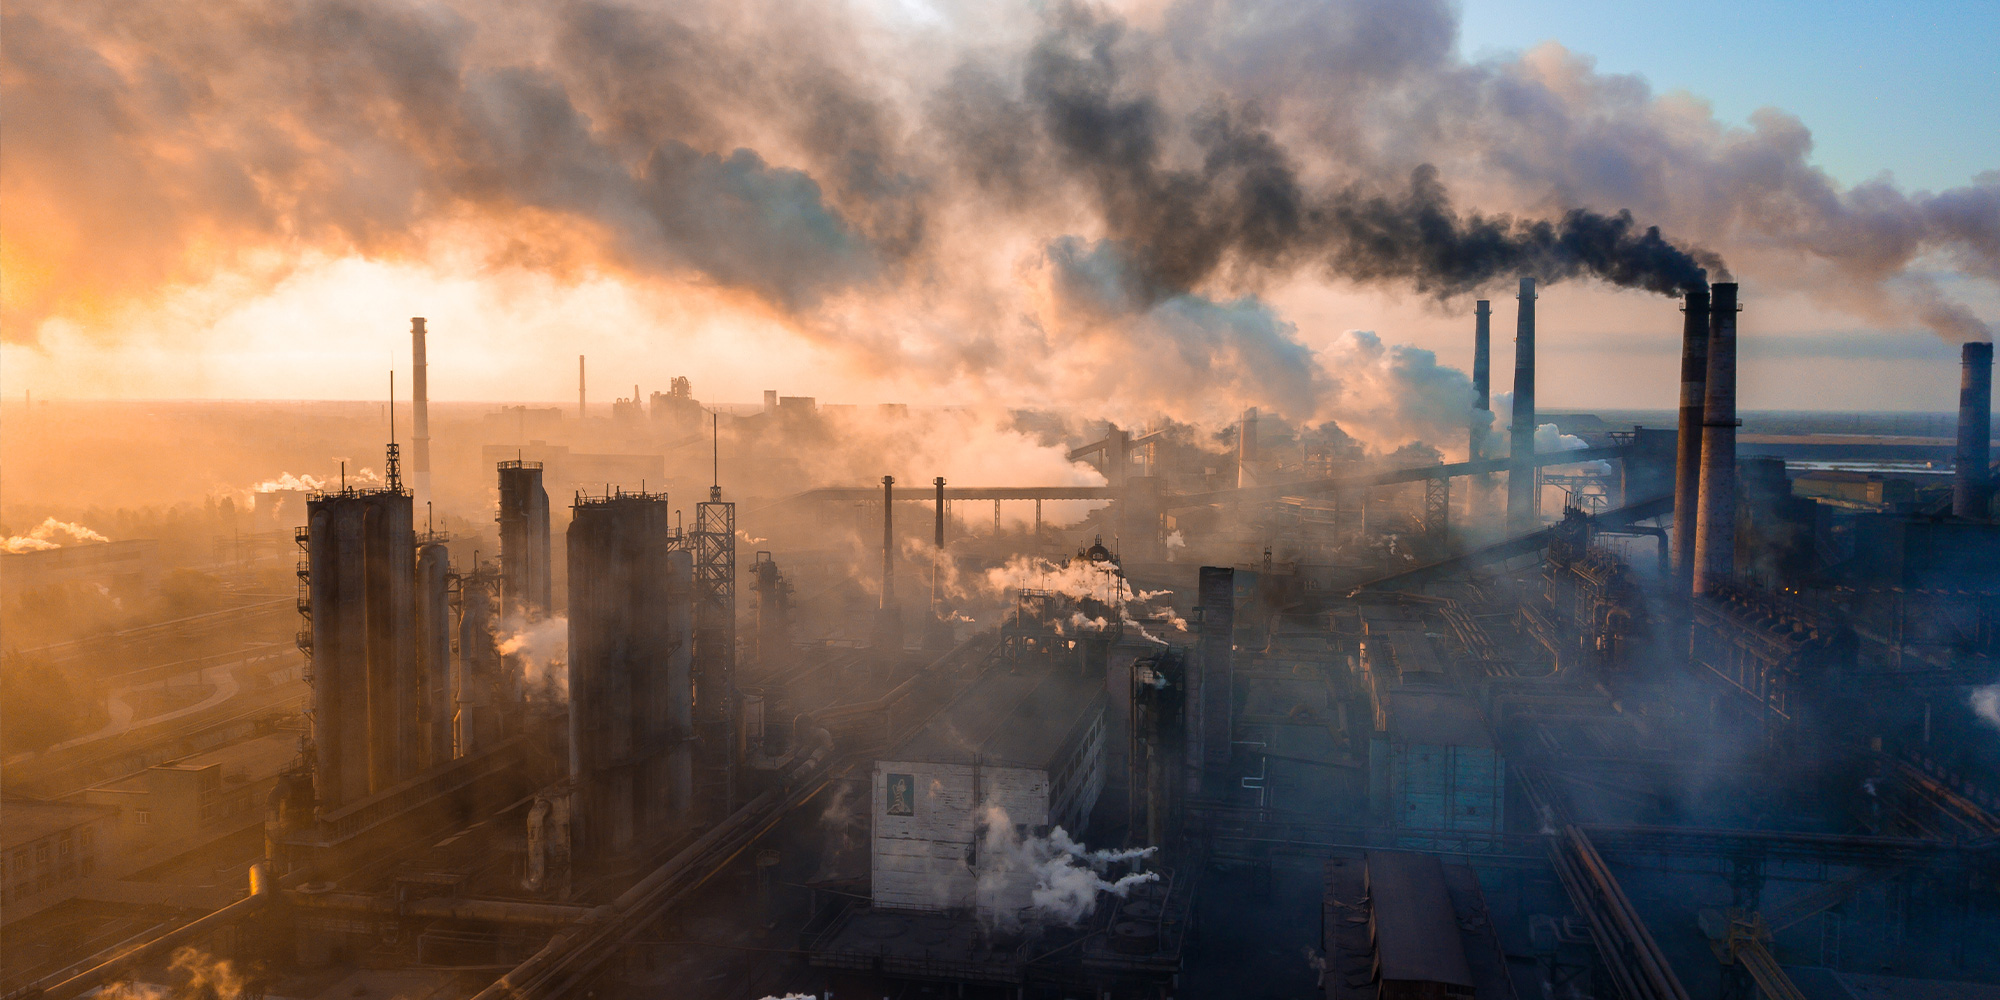
Human activities are resulting in more greenhouse gases being released than nature intended, upending the atmospheric elemental balance.

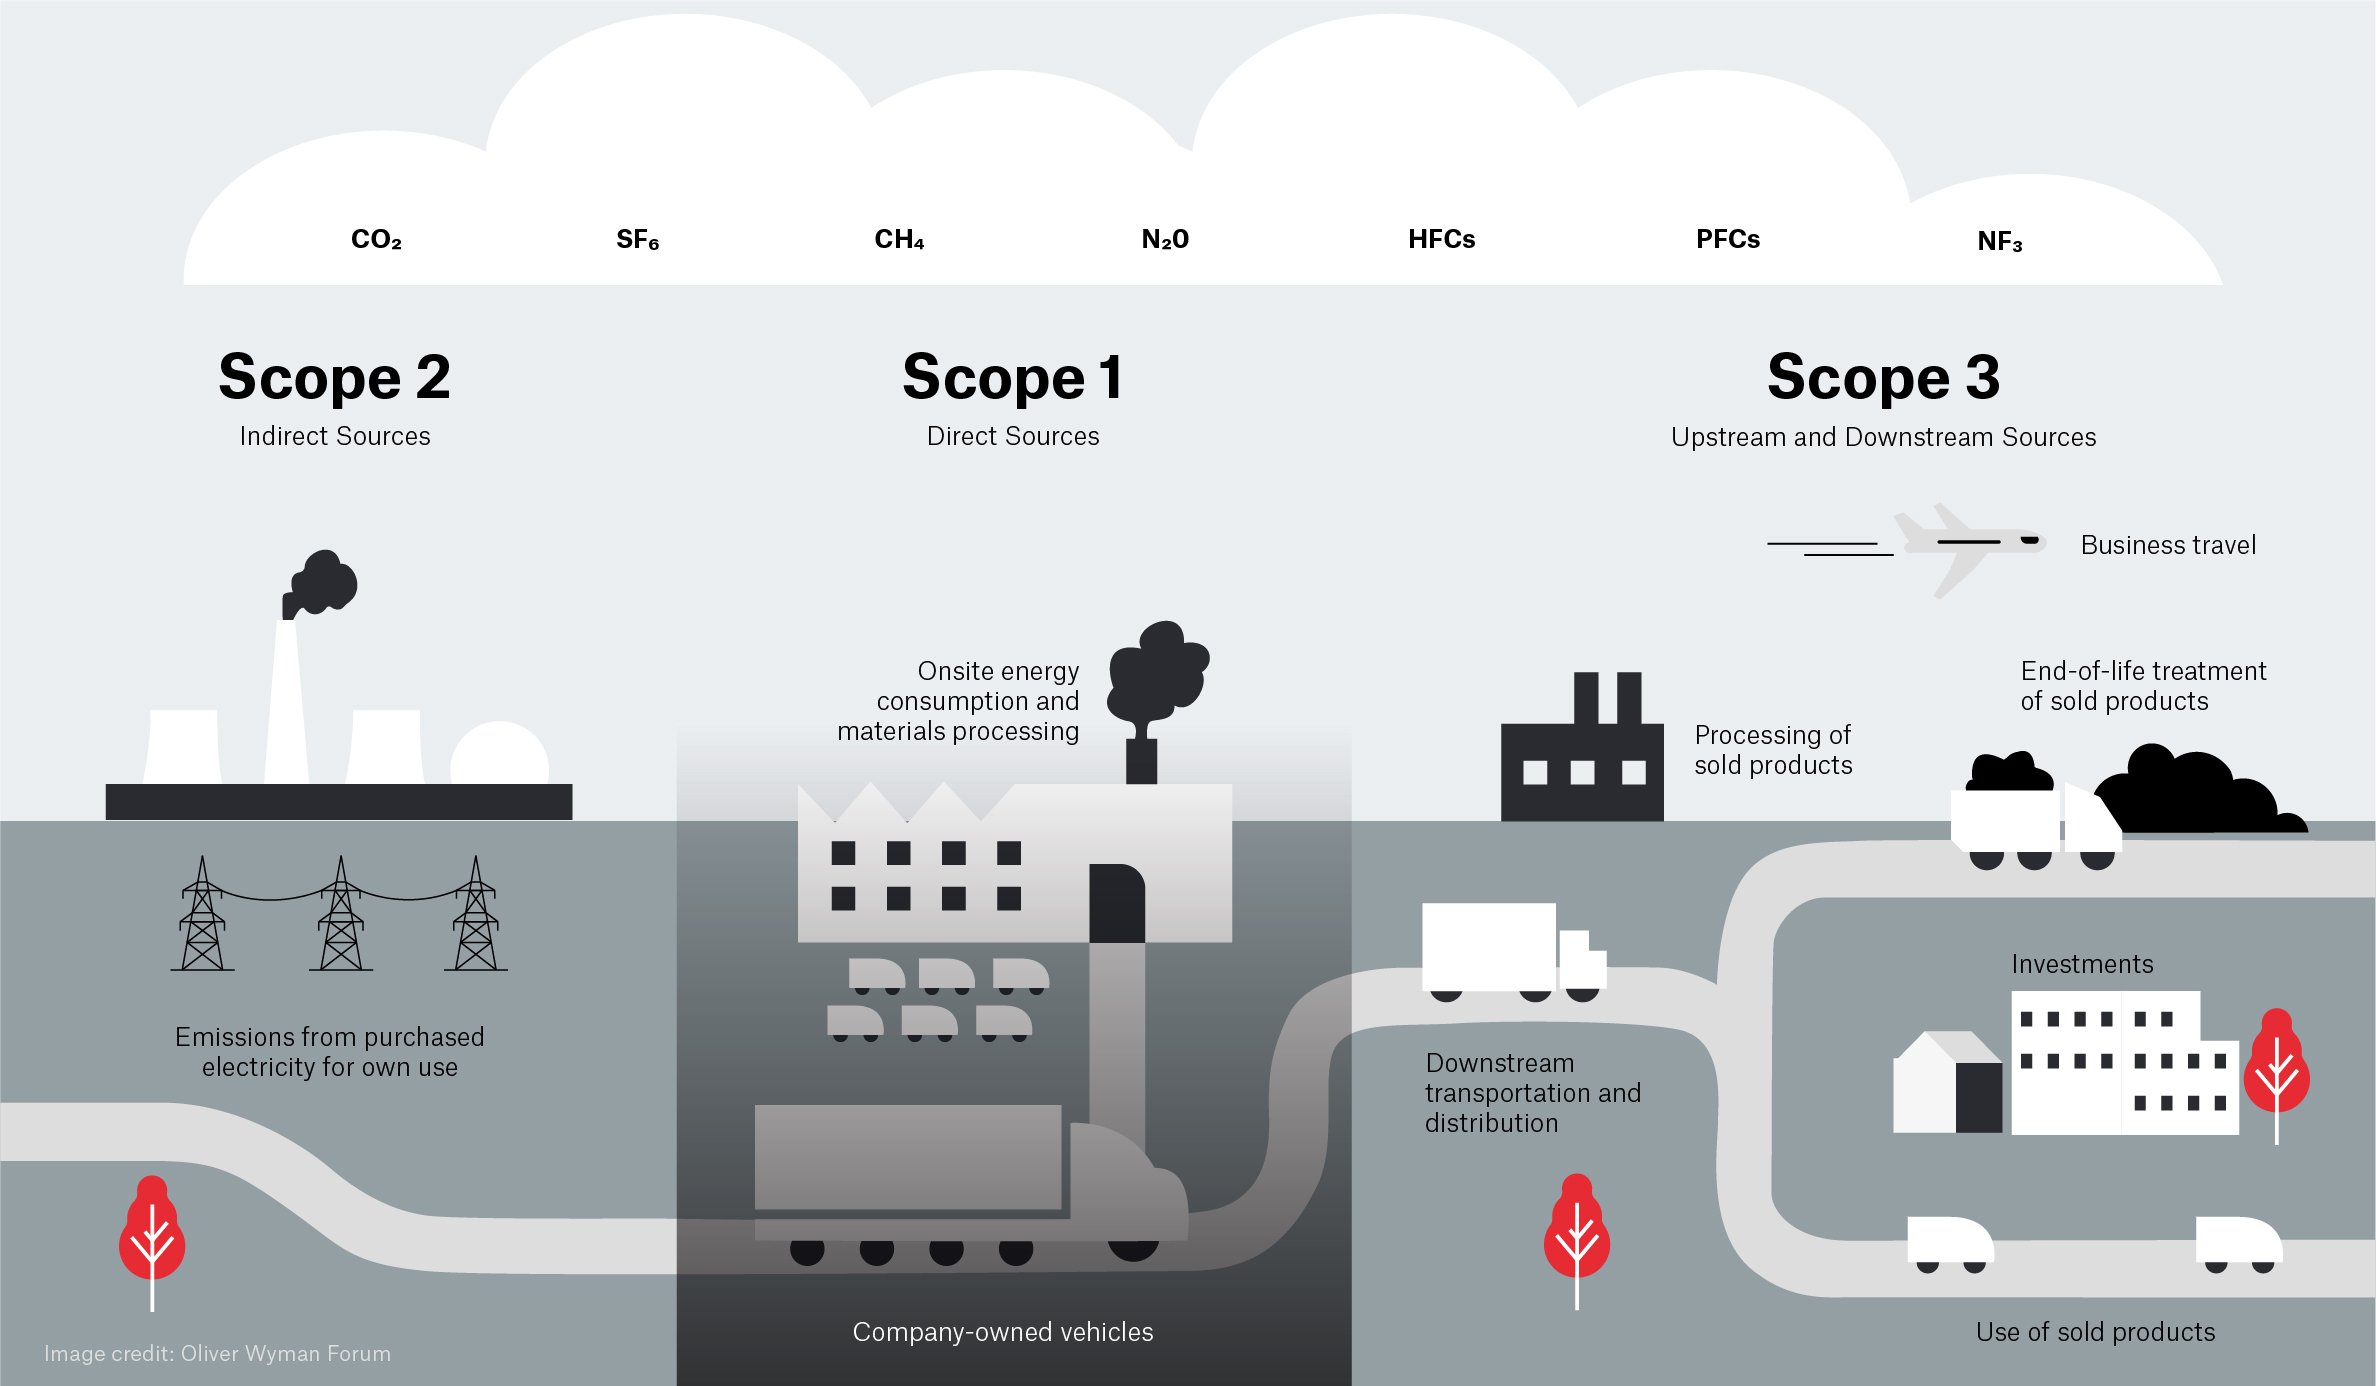
Carbon dioxide (CO2)
Methane (CH4)
Nitrous oxide (N2O)

Fluorinated gases (F-gases)
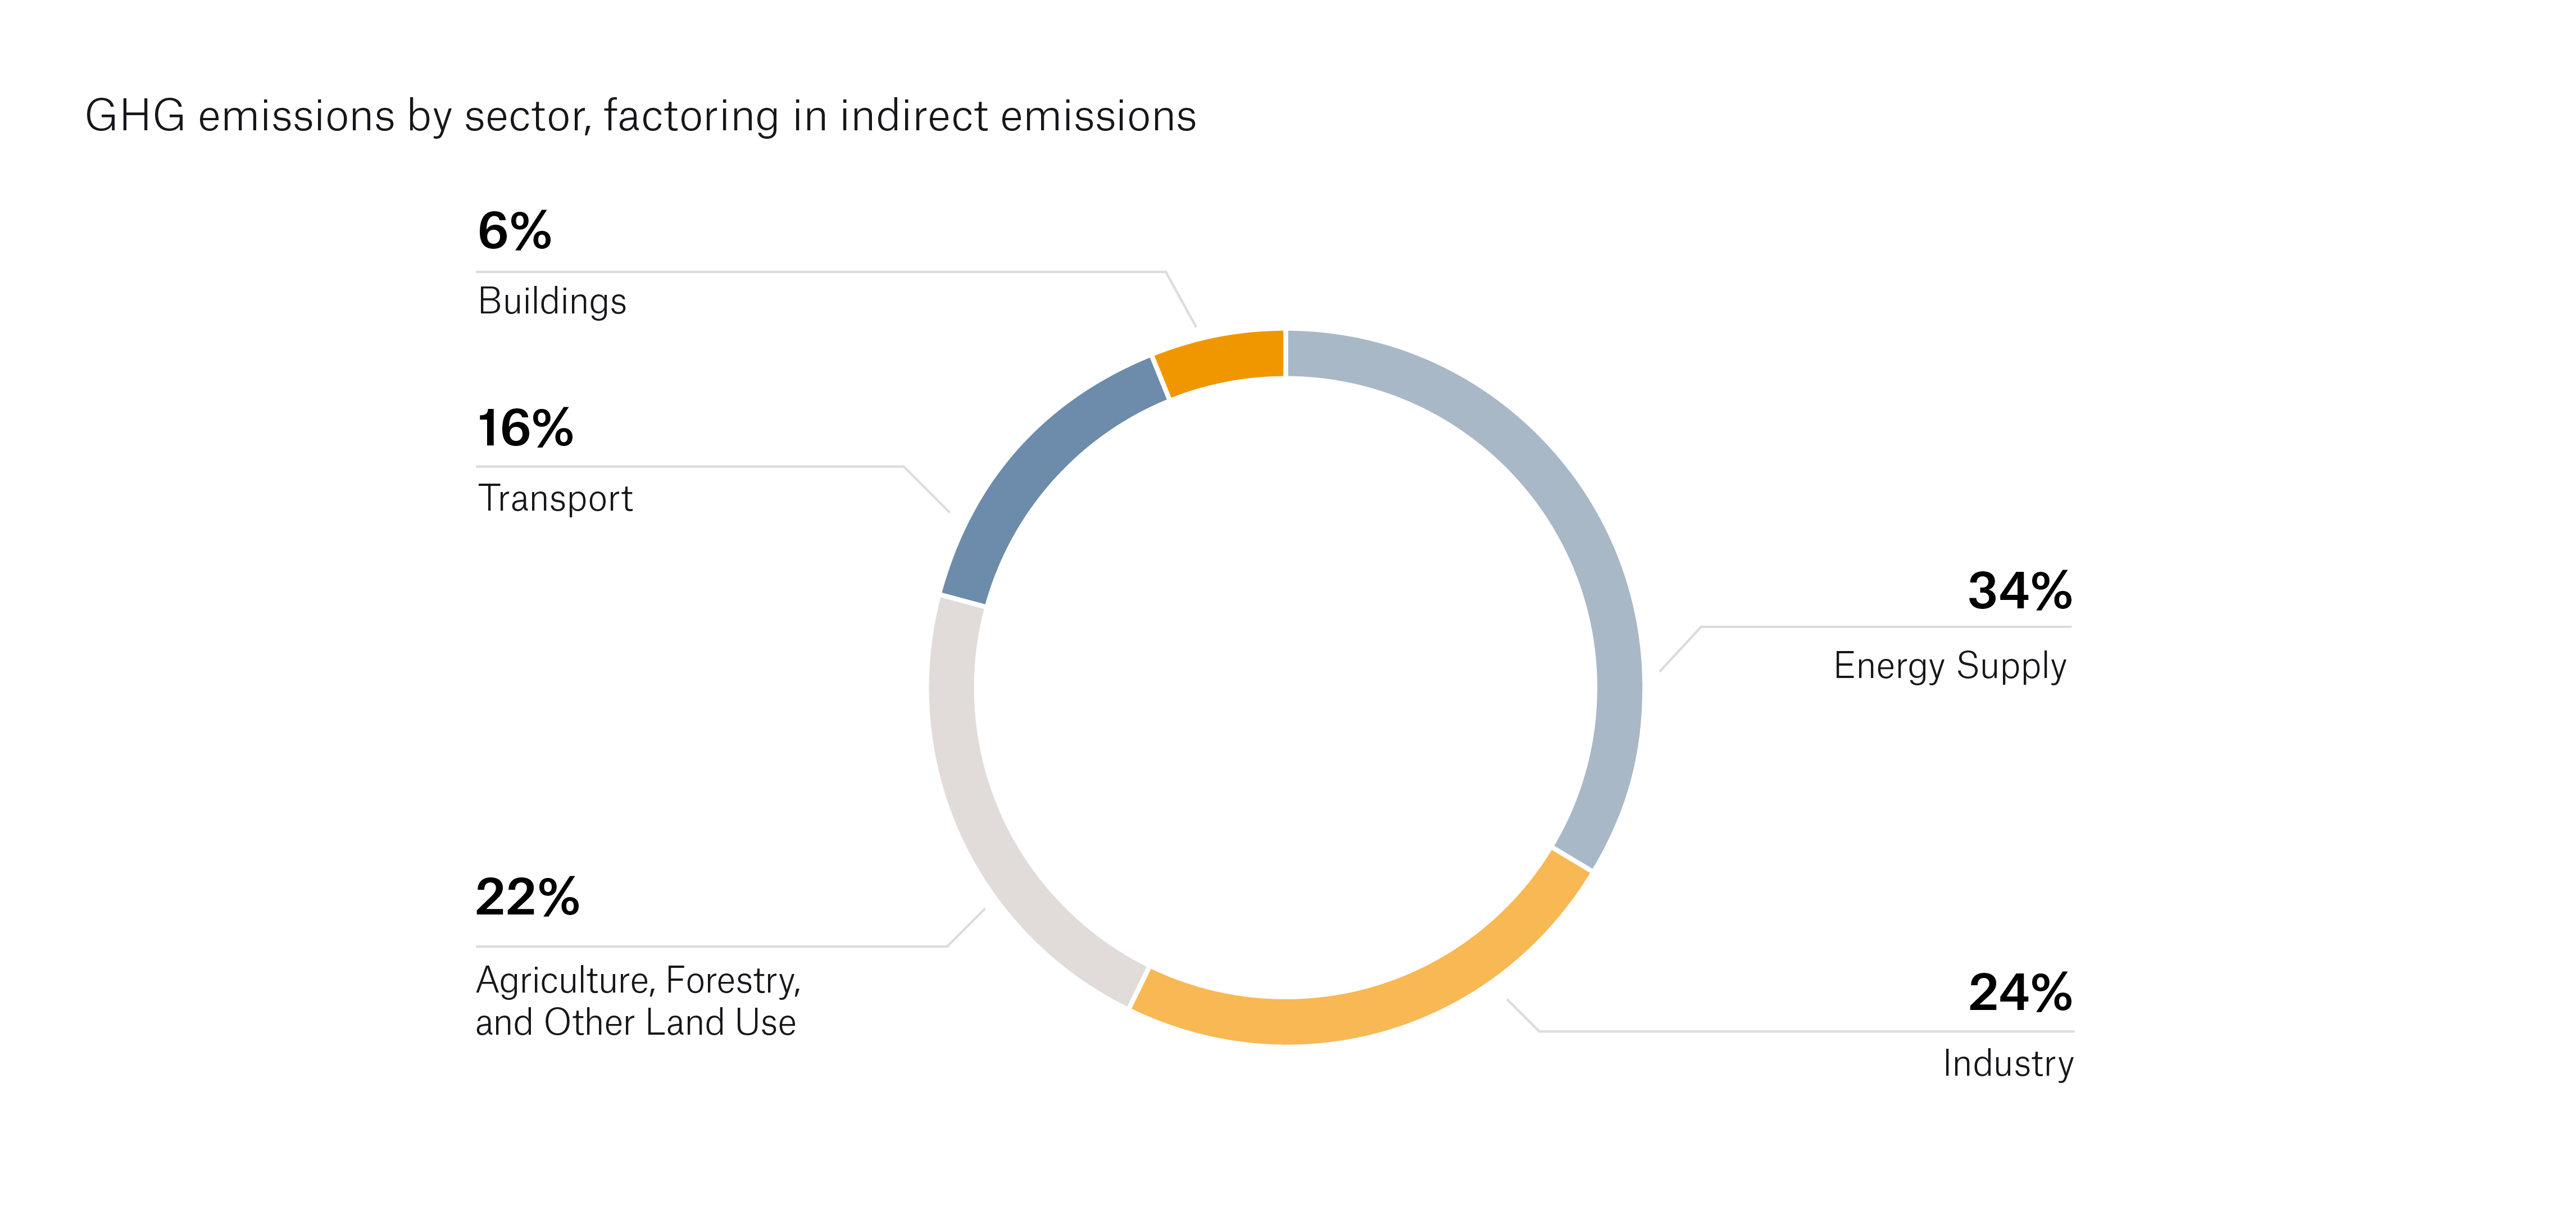
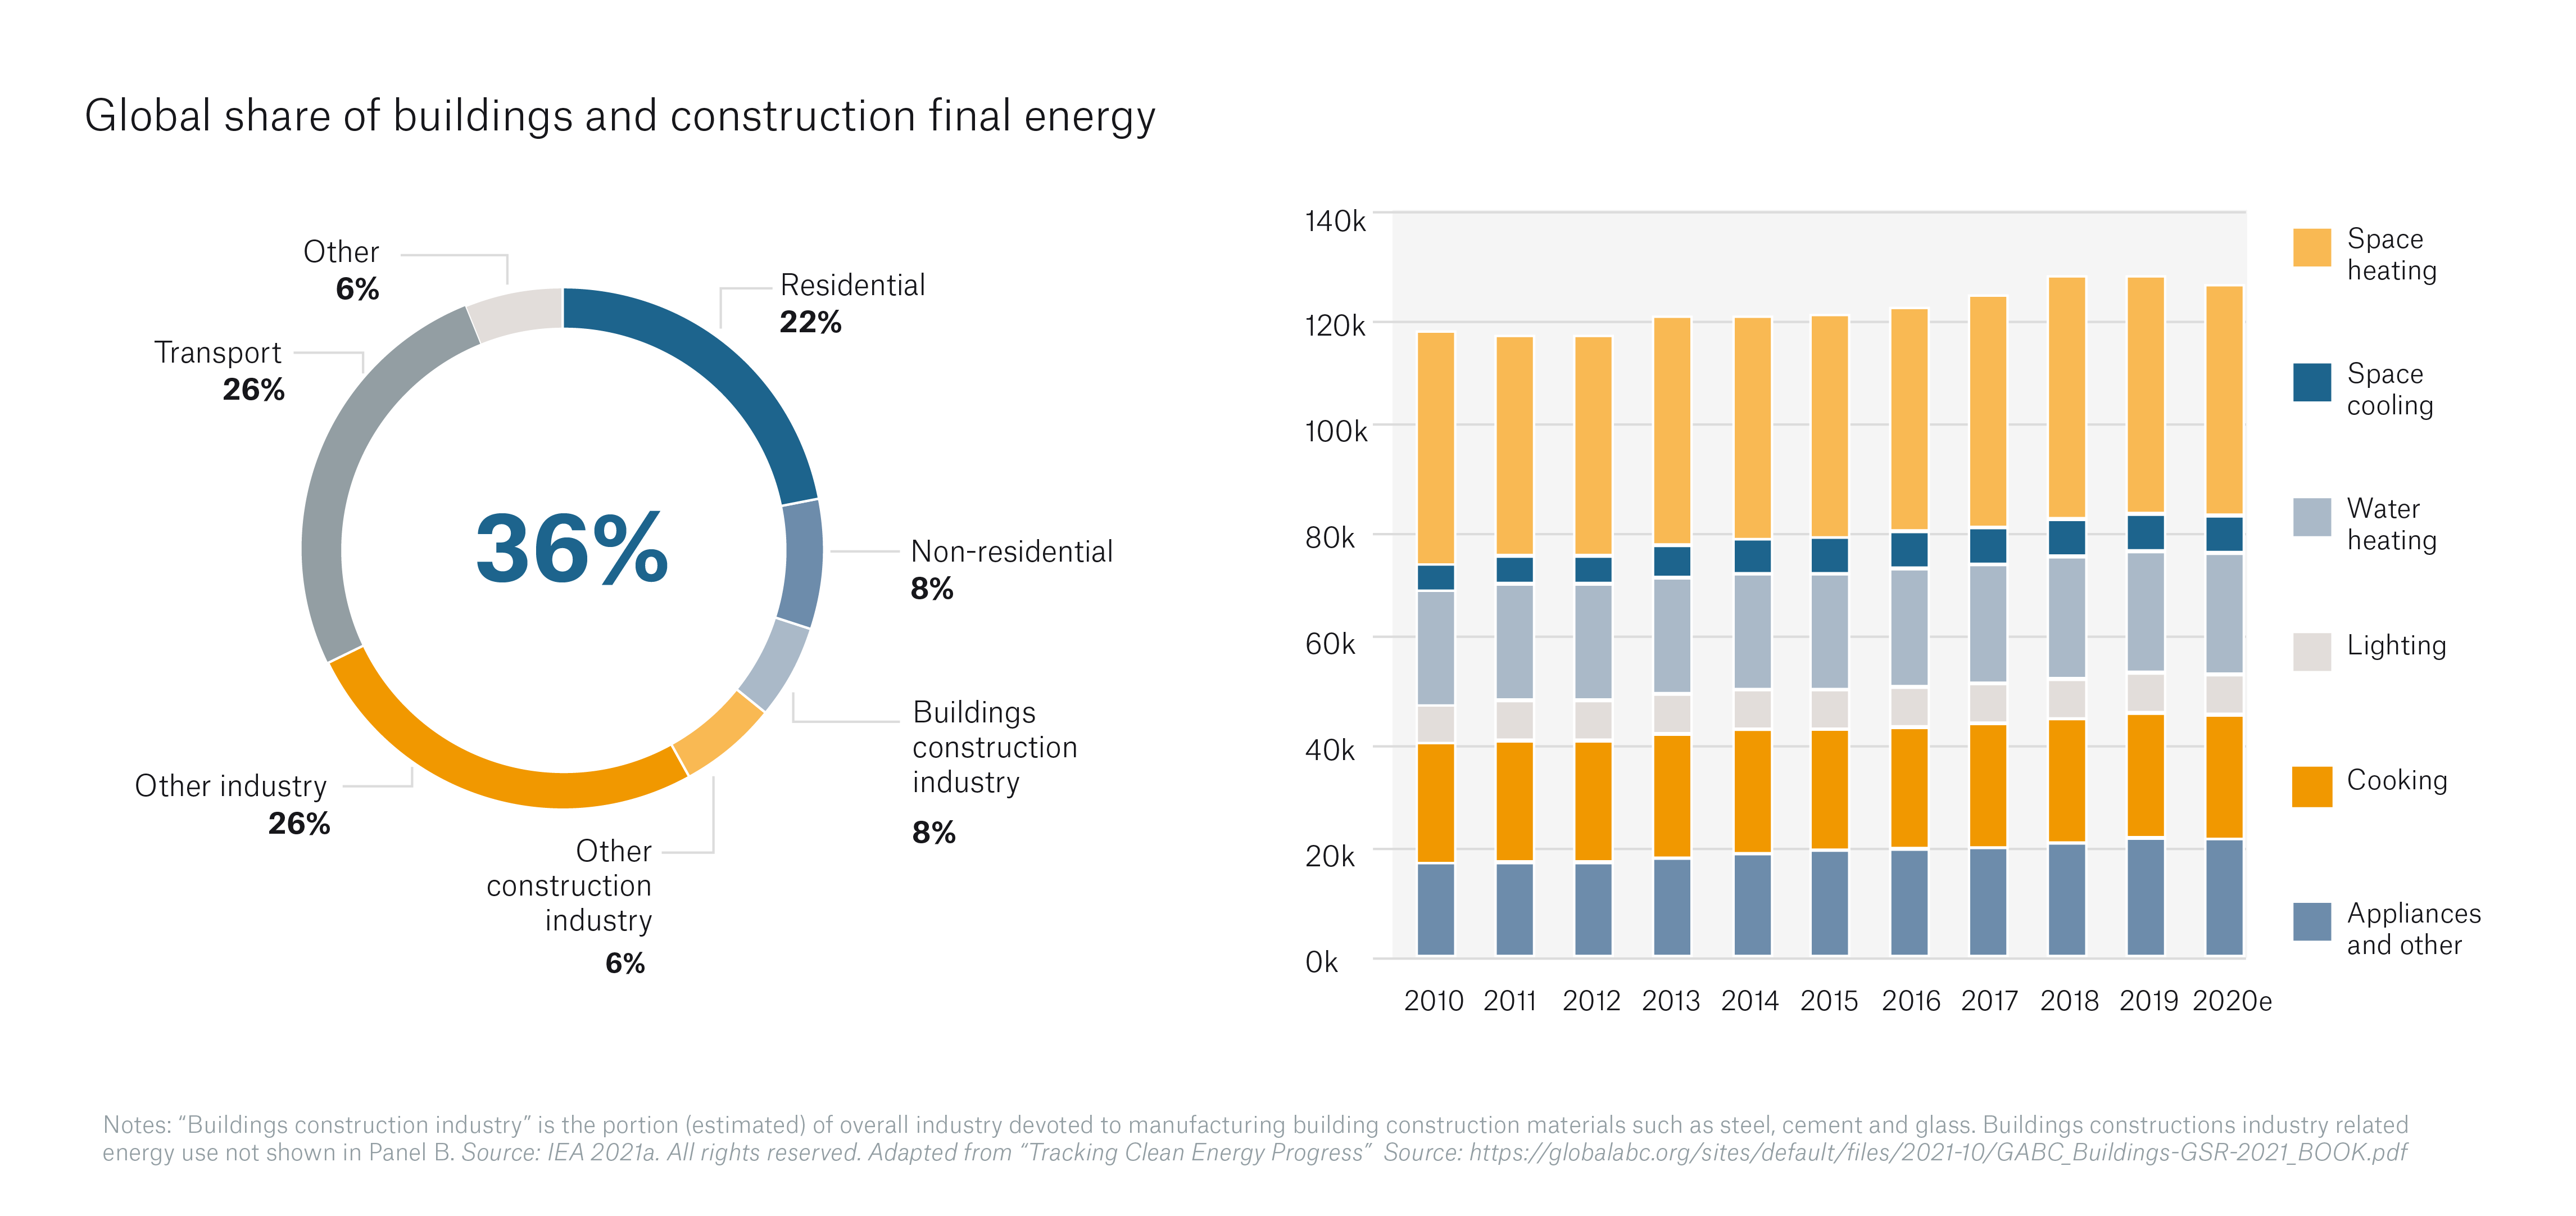
According to the IPCC, approximately 34% of total GHG emissions come from the energy supply sector; 24% from industry; 22% from agriculture, forestry, and other land use; 15% from transport; and 6% from buildings. However, if emissions were assigned to the sectors that consumed the most electricity and heat, the industry and buildings sectors would take the lead, accounting for 34% and 16% of GHG emissions, respectively. This adjustment would consequently see the energy supply sector accounting for just 12% of global GHG emissions.

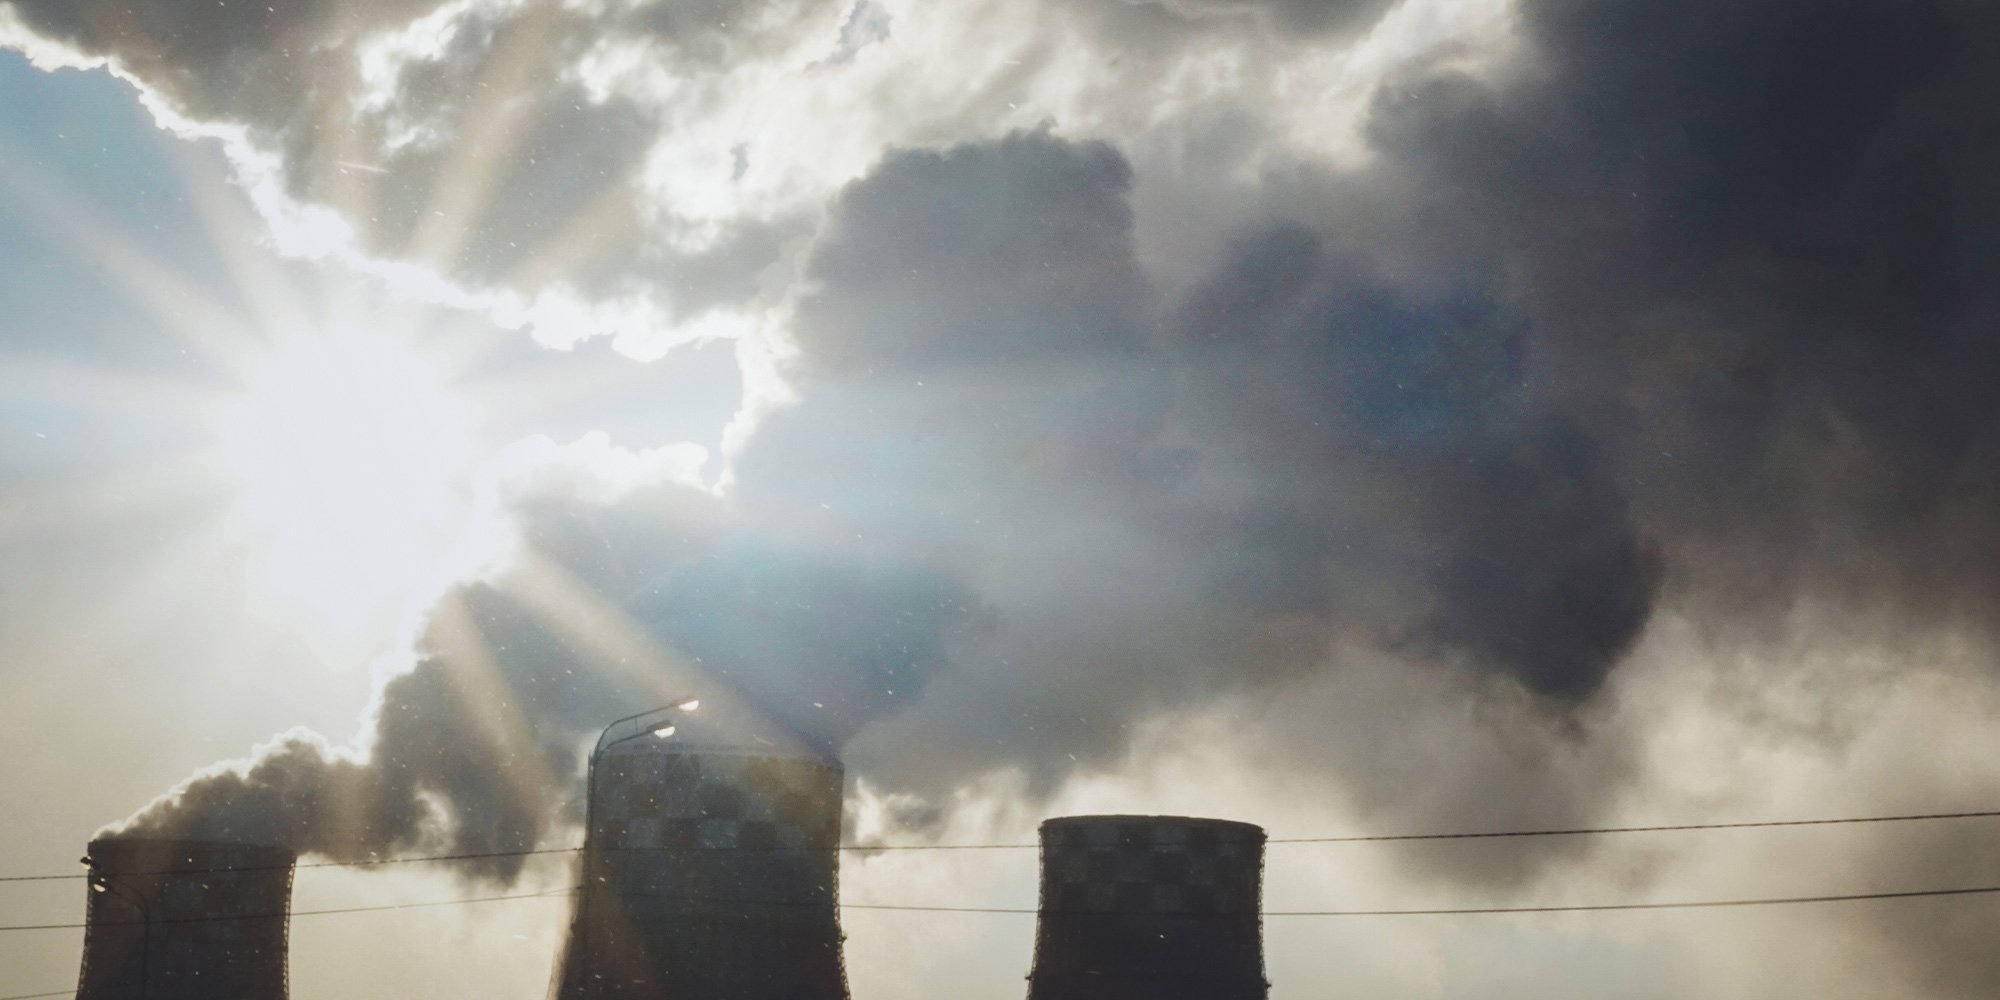
To produce a given amount of electricity, burning coal will produce almost two times more CO2 than natural gas and over 25% more than oil. This is why coal is referred to as the “dirtiest” fossil fuel.

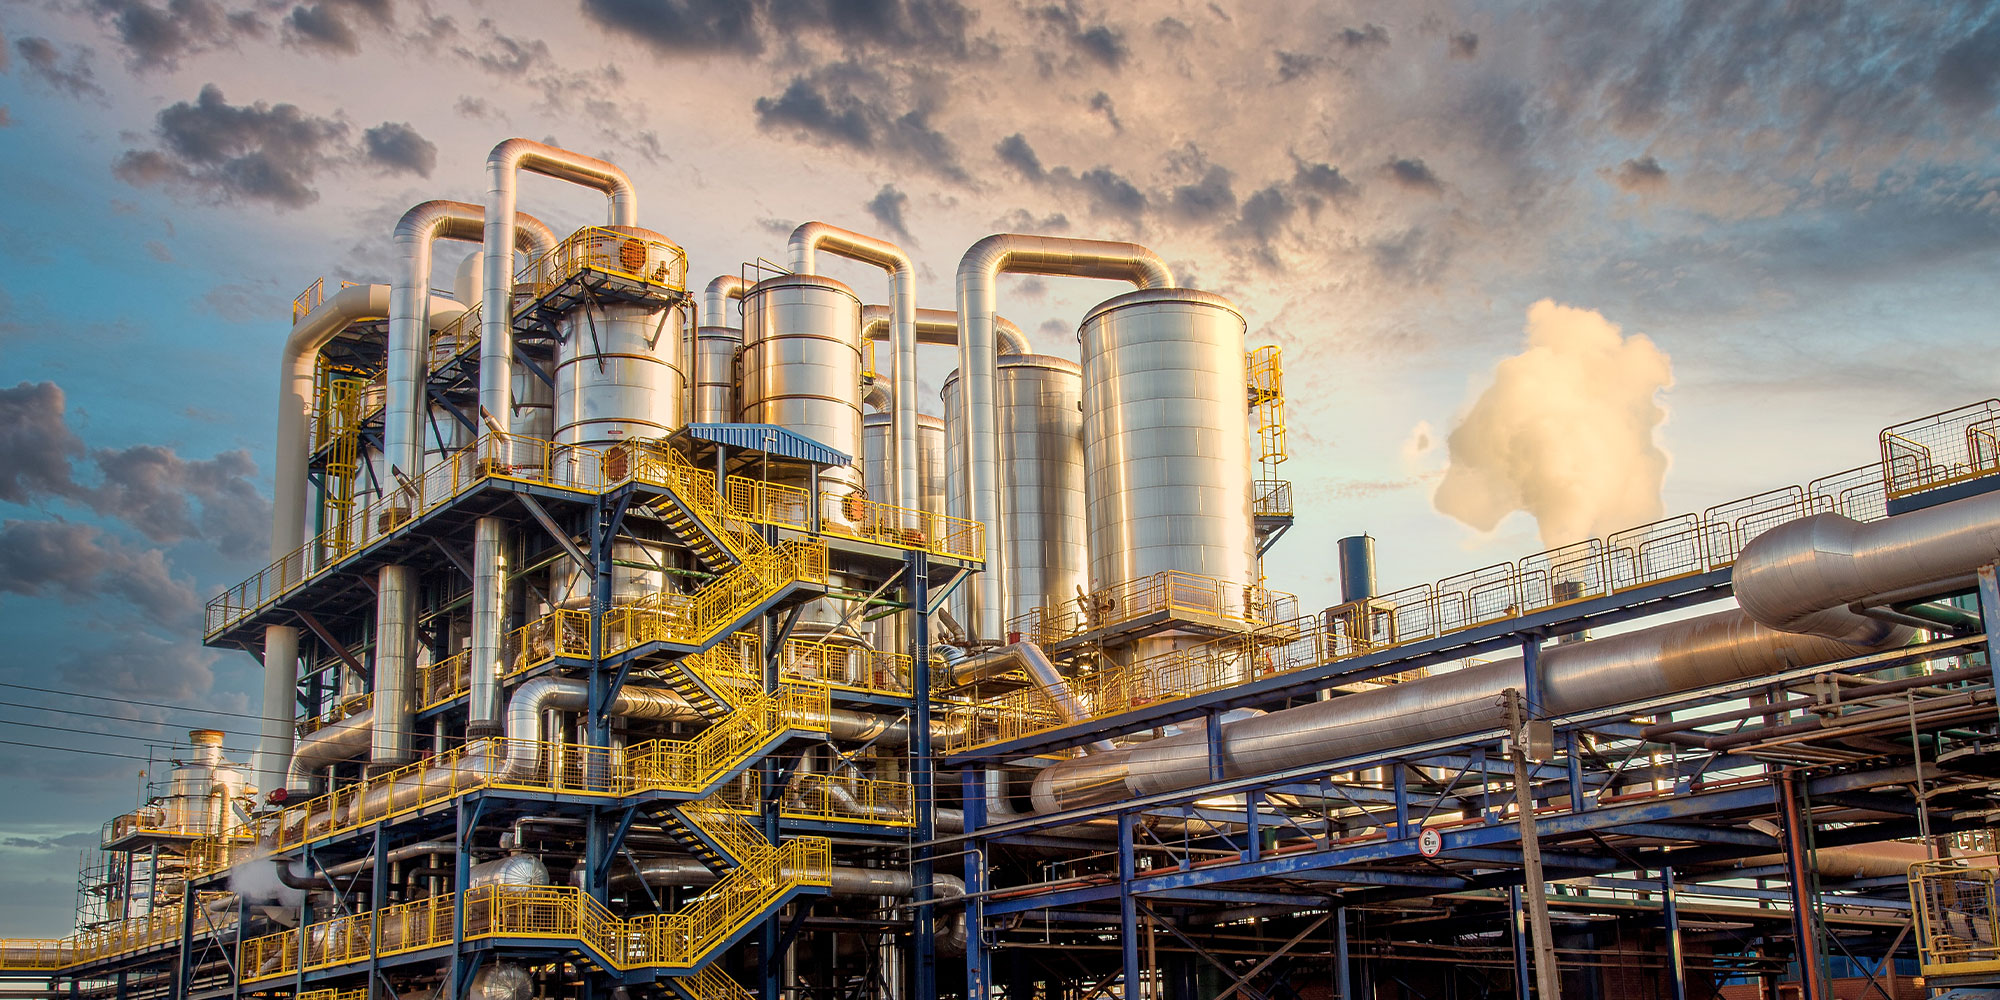
According to the IPCC, the industry sector’s energy intensity could be reduced by up to 25% through widescale upgrading, replacement, and deployment of efficient technologies.

Agricultural lands occupy about 40- 50% of the Earth’s land surface.
About 57% of the GHGs emitted by transportation in the US come from light-duty passenger vehicles.
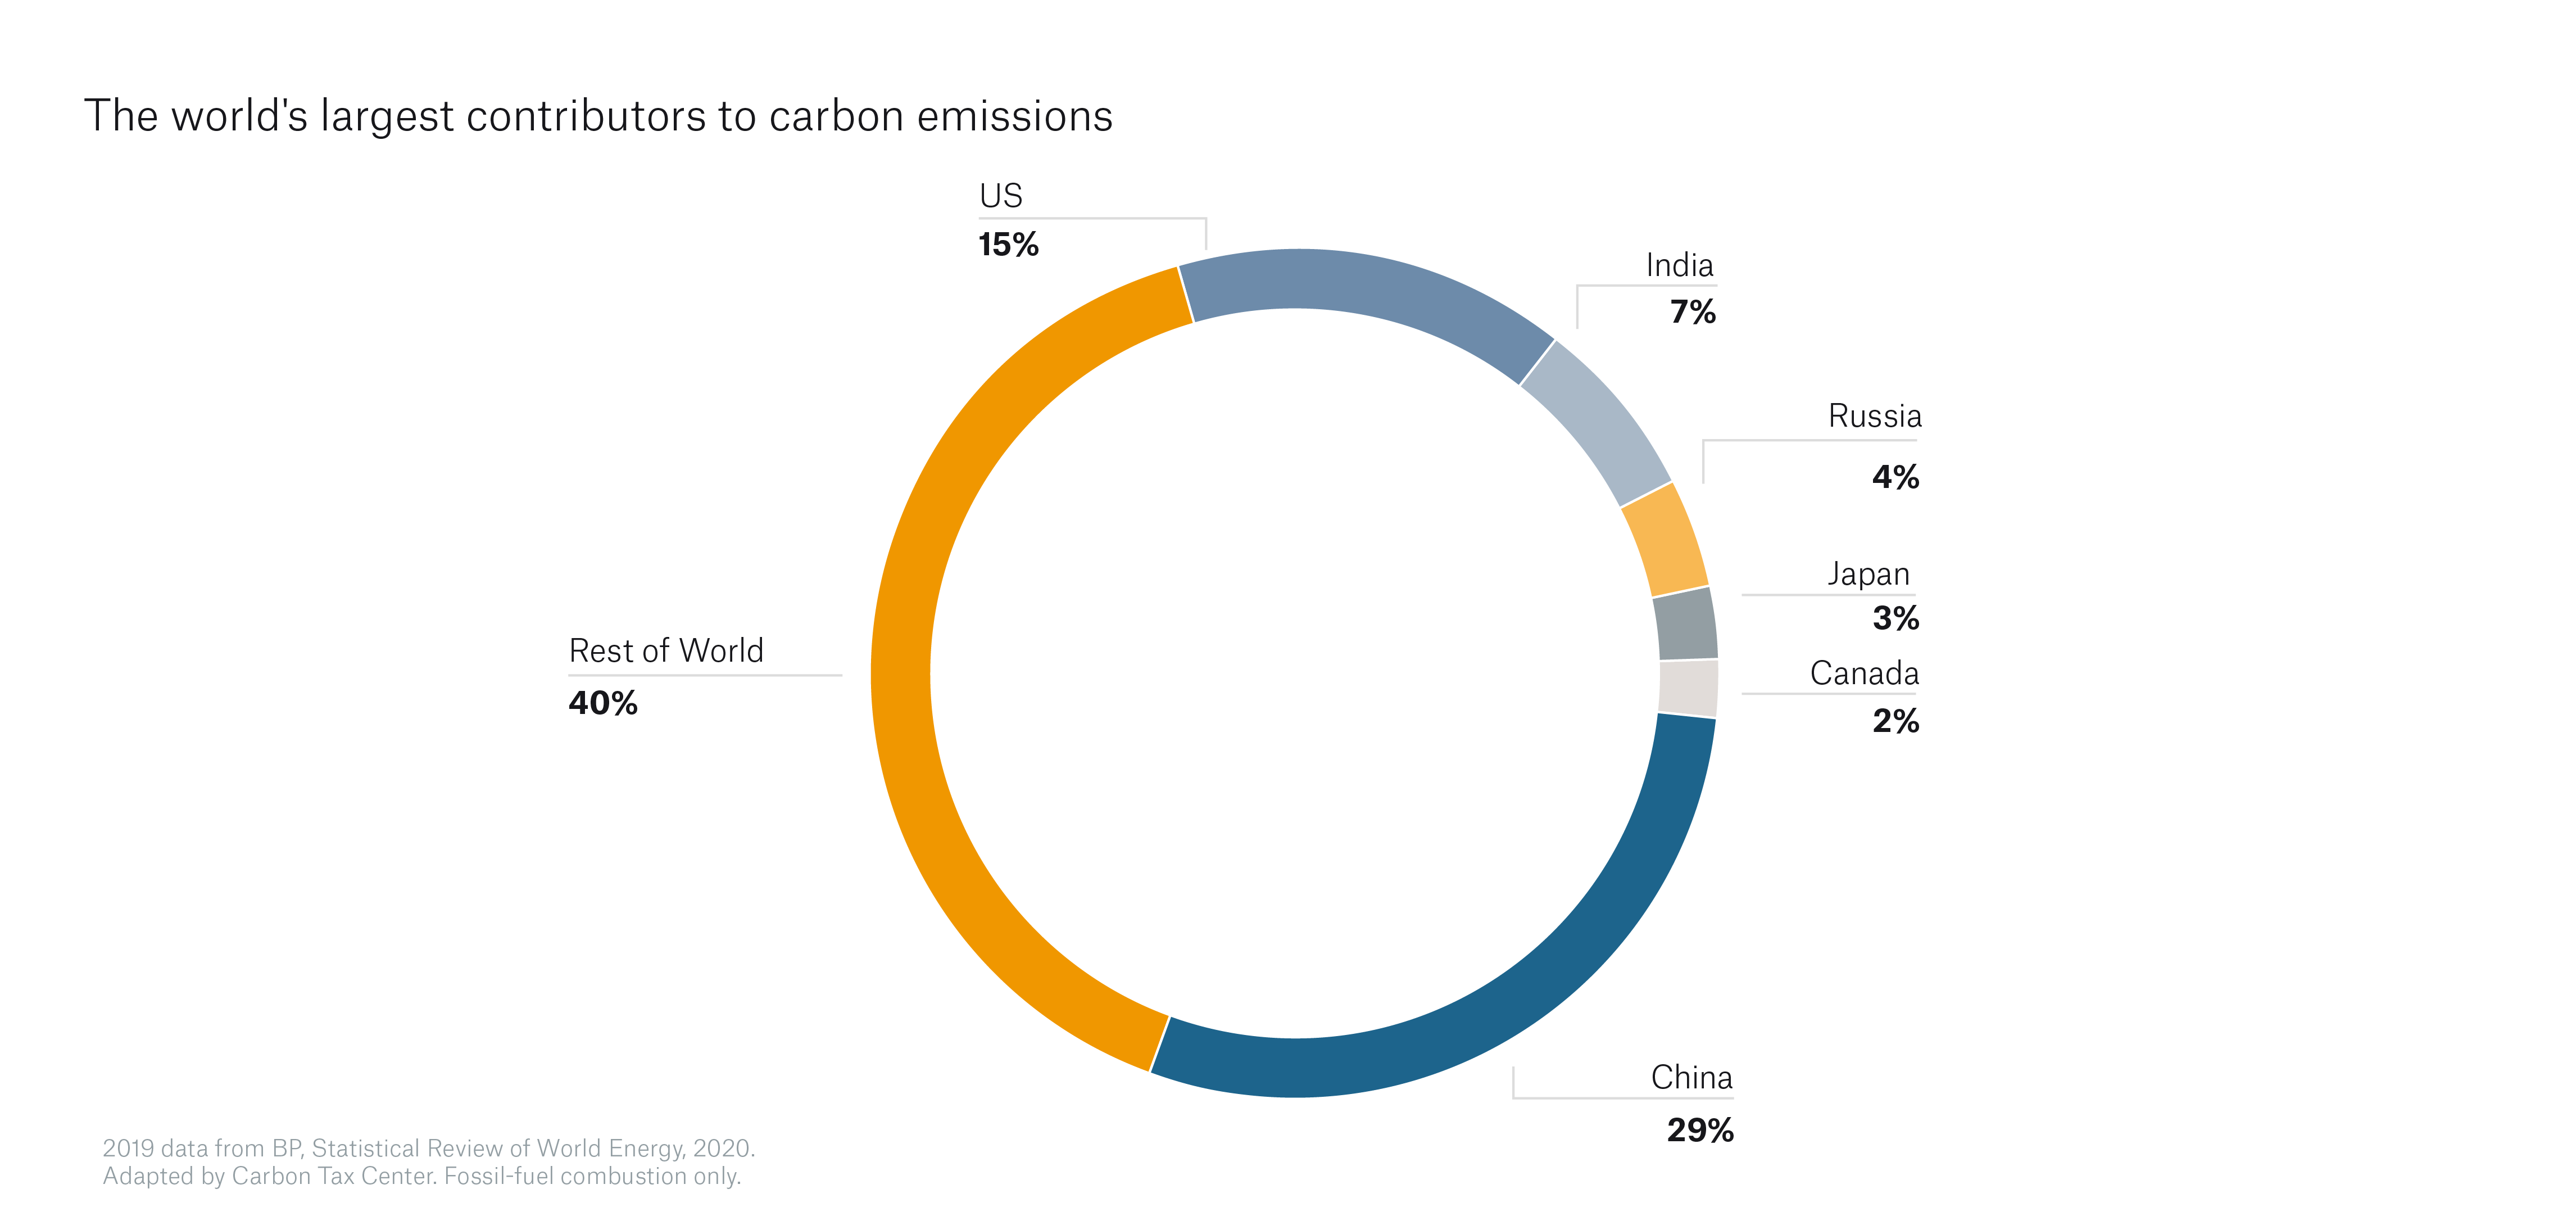
68% of global GHG emissions are produced by just 10 countries.


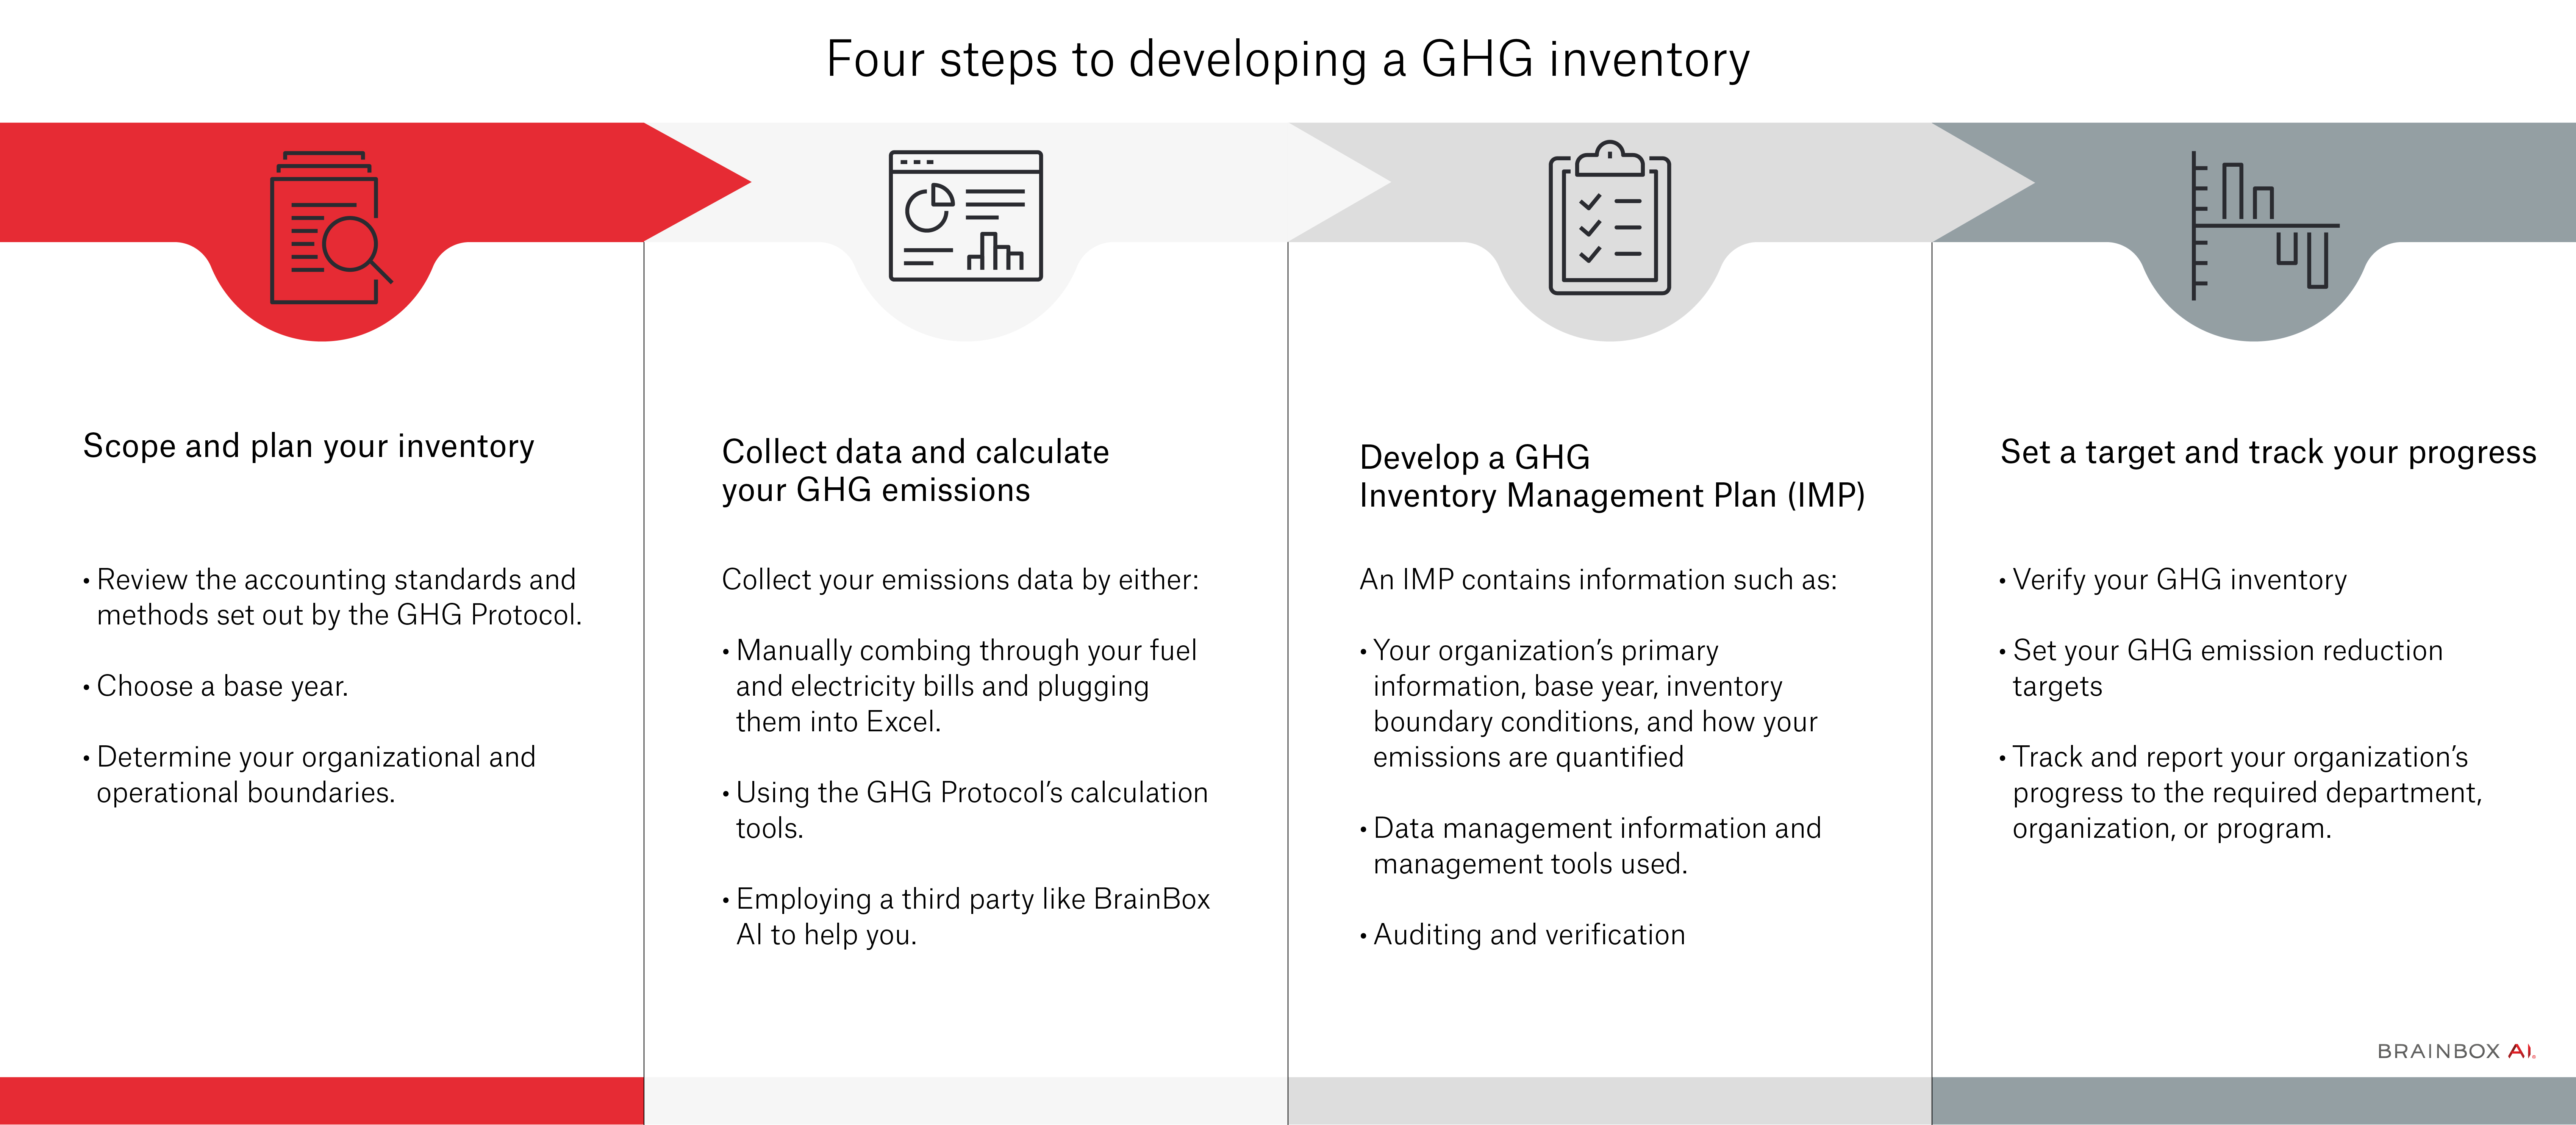


Download this guide
Find the strategies to reduce GHG emissions for your business
For a more in-depth look at how your company can reduce its GHG emissions, see our downloadable document on innovative strategies for reducing scope 1, 2, and 3 emissions.
Social responsibility report